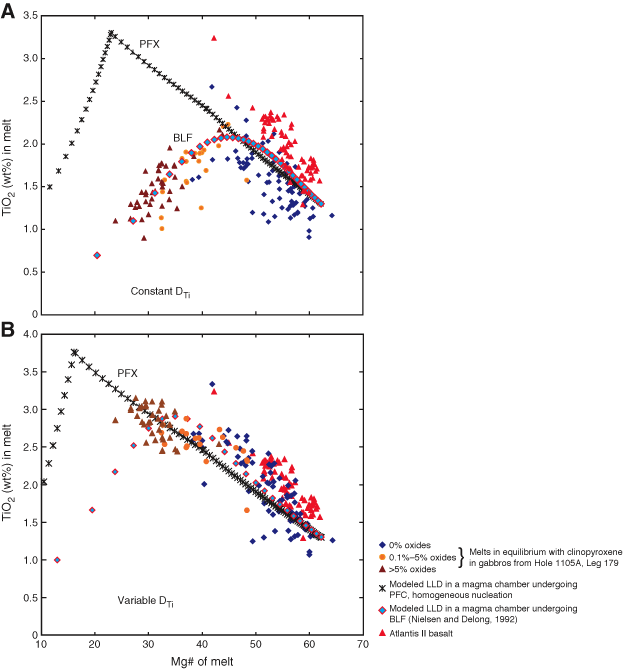
Figure F38. A. Plot showing relationship between Mg# of melt and TiO2 in melt for a modeled primitive Atlantis II Transform basalt (from Johnson and Dick, 1992). Liquid lines of descent (LLDs) from perfect fractional crystallization (PFX) and boundary layer fractionation (BLF) modeling is plotted. BLF modeling assumes 60% fractionation in the boundary layer. Also plotted is melt in equilibrium with clinopyroxene from Hole 1105A gabbroic samples calculated with constant clinopyroxene (cpx)/melt partition coefficients of 0.23 for FeO/MgO (Roeder and Emslie, 1970) and 0.41 for TiO2 for (Johnson and Kinzler, 1989). The equilibrium melt is color-coded on the basis of modal oxide abundance in the gabbroic sample. Note when constant Ti Kd is used, BLF modeling fits the liquid trend of the gabbroic rocks. B. Plot showing relationship between Mg# of melt and TiO2 in melt for a modeled primitive Atlantis II Transform basalt (from Johnson and Dick, 1992). LLDs from PFX and BLF model results are plotted. BLF modeling assumes 60% fractionation in the boundary layer. Also plotted is melt in equilibrium with clinopyroxene from Hole 1105A gabbroic samples calculated with constant cpx/melt partition coefficient of 0.23 for FeO/MgO (Roeder and Emslie, 1970) but a variable coefficient for TiO2. Variable Kd was used to calculate the TiO2 in equilibrium melt with the clinopyroxene in the gabbroic rocks based on the relationship between DTi and Al(IV) (see Fig. F30, and discussion in text). Note differences in LLDs produced for the plutonic suite and the limited compositional range of Atlantis II MORB in comparison to Hole 1105A plutonics.


![]()