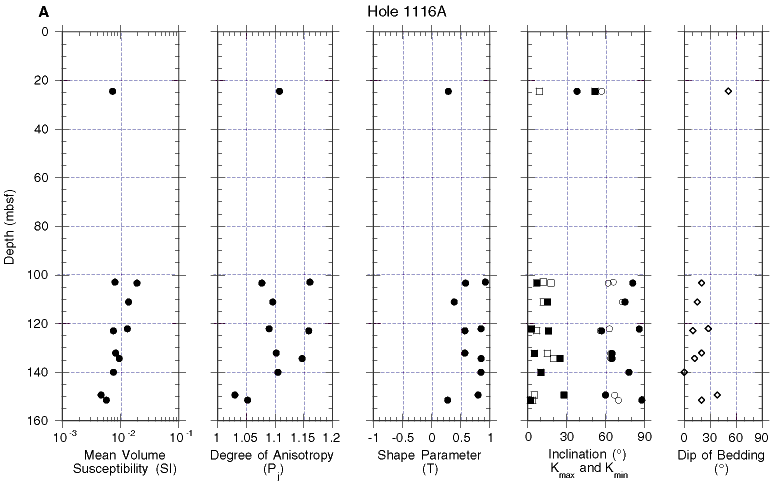
Figure F32. Susceptibility and its anisotropy (AMS) data from discrete sample measurements. A. Downhole variation in AMS parameters. Degree of anisotropy (Pj) and shape parameter (T) calculated according to Jelinek (1981). Kmax and Kmin are the maximum and minimum axes, respectively, of the susceptibility ellipsoid, and are shown corrected for bedding tilt as solid circles and squares; uncorrected data are shown as open circles and squares. (Continued on next page.)

![]()