![]()
![]() F1-F20
F1-F20
![]() F21-F40
F21-F40
![]() F41-F60
F41-F60
![]() F61-F80
F61-F80
![]() F81-F92
F81-F92
![]() T1-T18
T1-T18
F81. Magnetic field inclination and intensity in Hole 1118A.
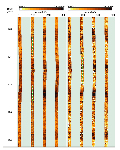
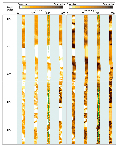
F82. Hole 1118A statically and dynamically normalized FMS images.
F83. Hole 1118A dynamically normalized FMS image and tadpole plot.
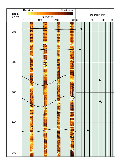
F84. Hole 1118A statically and dynamically normalized FMS images of log Unit L7.
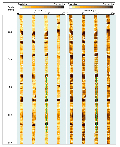
F85. Hole 1118A statically and dynamically normalized FMS images, log Unit L10.
F86. Hole 1118A temperature from triple combo first pass.
F87. Hole 1118A temperature data during TLT temperature pass.
F88. Temperature vs. ln[t/(t-s)] from TLT at 835 mbsf.
F89. VSP corridor stack between migrated MCS traces.
F90. Depth vs. transit time, Site 1118 VSP.
F91. Depth-converted MCS and VSP data.
F92. MCS Line EW9510-1366.
T1. Site 1118 coring summary.
T2. Site 1118 coring summary by section.
T3. XRD analysis of bulk fine-grained sediments.
T4. XRF analyses of dolerite for major elements.
T5. XRF analyses of dolerite for trace elements.
T6. Deformed intervals and corresponding structures.
T7. Stratigraphic distribution of calcareous nannofossils.
T8. Stratigraphic distribution of planktonic foraminifers.
T9. Interstitial water geochemistry, Site 1118.
T10. Headspace gas in sediments, Site 1118.
T11. Calcium carbonate, carbon, nitrogen, and sulfur contents.
T12. Bacterial populations and dividing and divided cells.
T13. Index properties measured, Site 1118.
T14. Longitudinal and transverse velocities, Site 1118.
T15. Thermal conductivity values, Site 1118.
T16. Summary of logging operations, Site 1118.
T17. Data for each station during the VSP experiment.
T18. Comparison of VSP check-shot data with depth estimates.
![]() F1-F20
F1-F20
![]() F21-F40
F21-F40
![]() F41-F60
F41-F60
![]() F61-F80
F61-F80
![]() F81-F92
F81-F92
![]() T1-T18
T1-T18