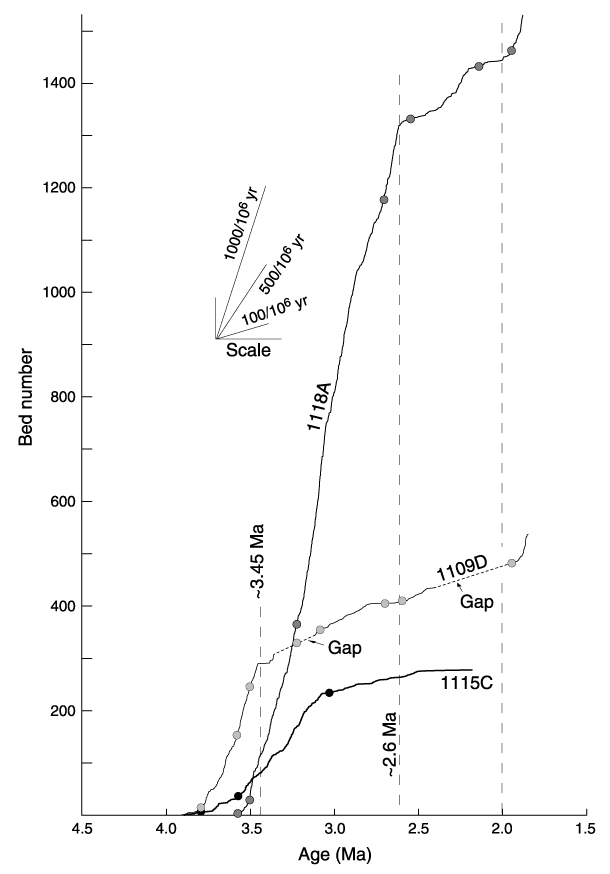
Figure F13. Plots of turbidite bed number (above the base of each column in Fig. F4) against the age of the base of each bed, using age picks from Table T1 (extracted from Takahashi et al., this volume). Between age picks (circles along curves), accumulation rates are assumed to be constant. Each plot shows the rate at which turbidite beds were added to the stratigraphic succession. Across the "gaps" in Hole 1109D (no FMS data or very poor quality images), the slope of the growth curve is constrained by adjacent segments of the curve. See "Turbidity-Current Frequencies," in "Results" for discussion.

![]()