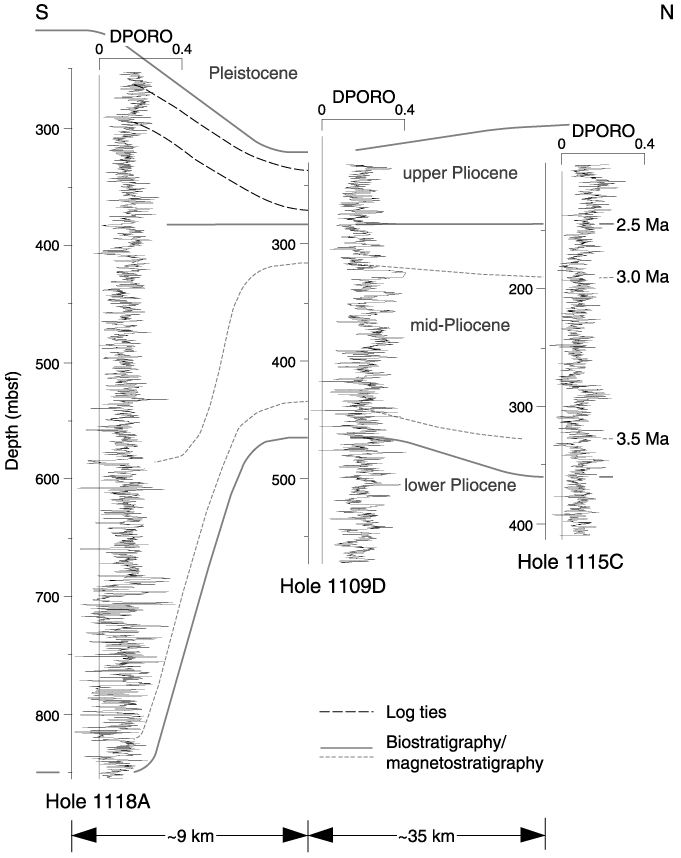
Figure F3. DPORO profiles hung on the mid- to upper Pliocene boundary and correlated using age ties from Takahashi et al. (this volume). Calculation of DPORO is explained by Célérier et al. (this volume). Figure F4 shows FMS-based bed-by-bed sections plotted on the same correlation template.

![]()