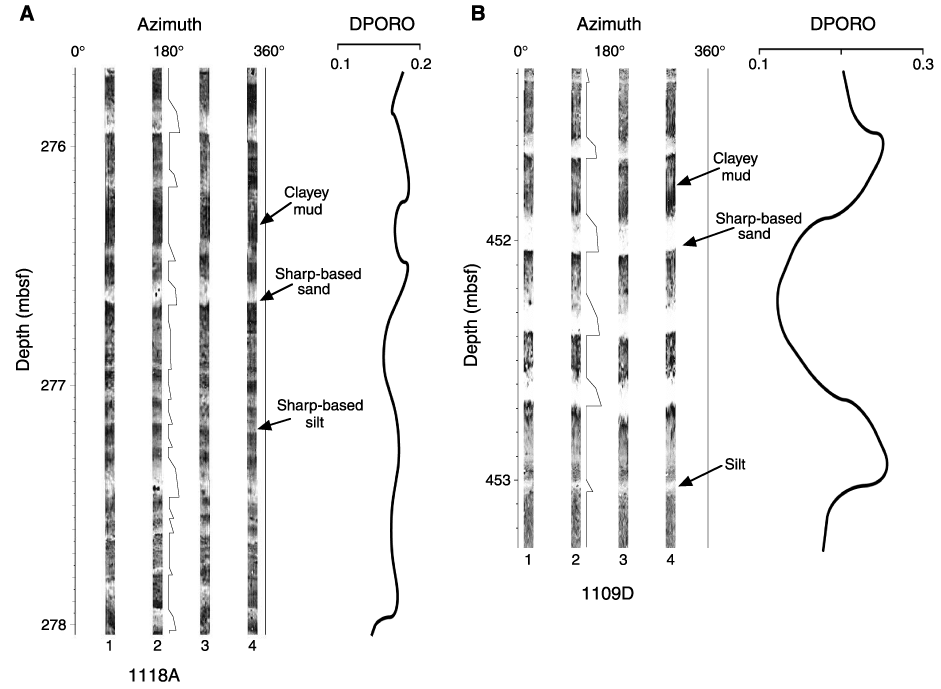
Figure F5. FMS images of Facies A. The four strip images are located at right angles to one another around the borehole wall and follow the track taken by each spring-loaded pad as it was pulled up the open hole. Pseudo-weathering profiles between the images for pads 2 and 3 indicate relative grain-size variations. DPORO values are extracted from Figure F3 and indicate greater clay content with higher values (Célérier et al., this volume). A. Thin- to medium-bedded graded beds of sand and silt (Hole 1118A; 275.7-278.1 mbsf). B. Thin- to medium-bedded graded sands (Hole 1109D; 451.3-453.3 mbsf).

![]()