Figures F1-F2 Tables T1-T3
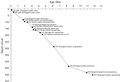
F1. Age-depth model.
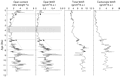
F2. Changes of opal content and MARs.
Tables T1-T3
T1. Sample information.
T2. Planktonic foraminiferal biostratigraphic datum levels.
T3. Opal content and MARs.