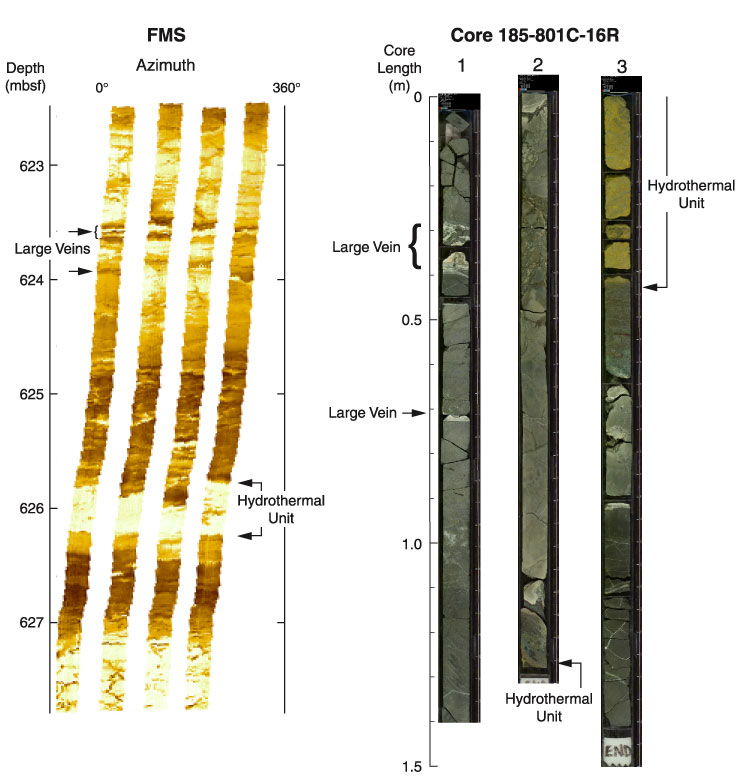
Figure F69. FMS microresistivity images correlated to specific features in Sections 185-801C-16R-1 to 16R-3. The hydrothermal unit and two large veins are identified in both the FMS and core images. The meters below seafloor scale on the FMS images shows the depth range of this interval after the 2-m downshift of the logs described in Figure F68.
![]()