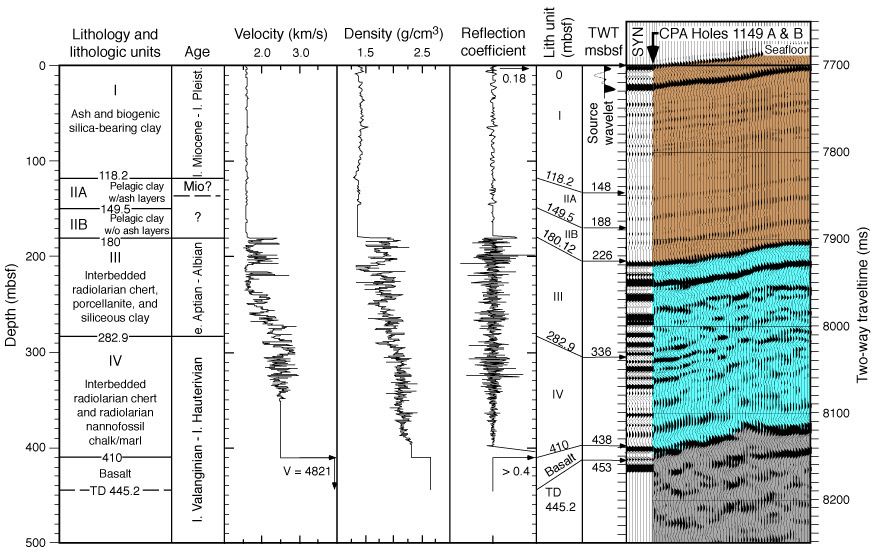
Figure F2. Logging and coring results (Shipboard Scientific Party, 2000c) and core-log-seismic correlation based on synthetic seismograms. The first two columns summarize the lithology, lithologic units, and biostratigraphic ages at Site 1149. Columns three and four show the velocity and density profiles derived from merging laboratory and downhole measurements. Column five shows the reflection coefficient calculated from impedance contrasts obtained from the composite velocity and density data. Columns six and seven show selected depth (mbsf) to time (msbsf) correlations from matching the synthetic and observed seismograms. The seismic source signature that is convolved with the reflection coefficient to create the synthetic seismogram (SYN) is shown at the top of column seven. The synthetic seismogram is presented as 10 adjacent traces in column eight. Column nine shows an ~1.8-km portion of JOIDES Resolution SCS water gun line 2. Synthetic and observed seismograms are displayed with no filtering and true amplitude. The locations of Holes 1149A and 1149B are shown with an arrow. Regionally identified seismic units are color coded as described in the text and Figure F4. TD = total depth, TWT = two-way traveltime, msbsf = milliseconds below seafloor, V = velocity.