![]() Figures F1-F11
Figures F1-F11
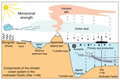
F1. Climate/ocean system in the northwest Pacific.
F2. Normative calculations on the basis of the geochemical results.
F3. Downhole plot of paleomagnetic and geochemical results.
F4. Bivariate scatter plots.
F5. Examples of IRM acquisition and backfield measurements.
F6. Sample 185-1149A-3H-2, 100 cm.
F7. Intensity of NRM, inclination, and declination.
F8. Details of the inclination, ARM, and Mn/Al across the B/M boundary.
F9. Spectral analysis of Al.
F10. The correlation of the CaO record to SPECMAP.
F11. Average sedimentation rates.