![]() Figures F1-F28
Figures F1-F28
![]() Tables
T1-T2
Tables
T1-T2
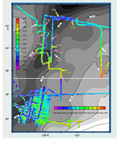
F1. Southeast Indian Ocean regional map with Leg 187 operational area and possible isotopic boundary configurations.
F2. Along-axis profiles of isotopic ratios and bathymetry from the AAD.
F3. Possible isotopic boundary configurations.
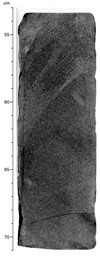
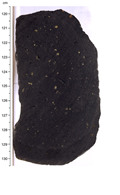
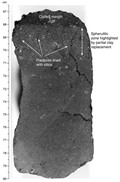
F4. Pillow fragment with chilled margin and fracture-controlled morphology.
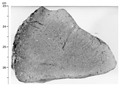
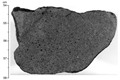
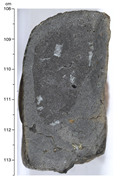
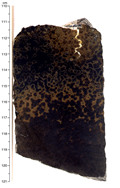
F5. Fresh massive basalt core.
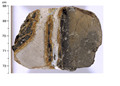
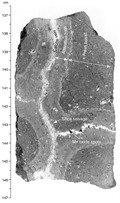
F6. Micritic limestone infilling a fracture and interpillow space.
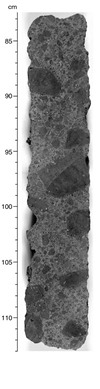
F7. Poorly sorted basaltic breccia.
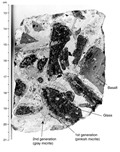
F8. Basalt and palagonitized glass clasts in calcareous sediment matrix.
F9. Microcrystalline aphyric basalt.
F10. Moderately plagioclase-olivine phyric pillow basalt.
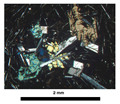
F11. Plagioclase + olivine glomerocryst.
F12. Sieve-textured plagioclase.
F13. Euhedral plagioclase phenocrysts in basalt.
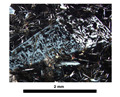
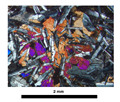
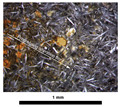
F14. Clinopyroxene plumose quench texture.
F15. Subophitic texture.
F16. Fractures lined with cryptocrystalline silica within chilled pillow margin.
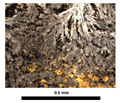
F17. Spherulitic pillow margin highlighted by Fe oxyhydroxide staining.
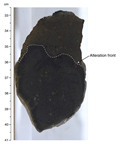
F18. Concentric alteration halos.
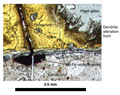
F19. Transition from smectite and Fe oxyhydroxide groundmass replacement to unaltered groundmass.
F20. Glassy pillow rind.

F21. Intersection of calcite veins with palagonite.
F22. Calcite veins.
F23. Variations in 206Pb/204Pb along the SEIR in the AAD and of Zr/Ba vs. 206Pb/204Pb.
F24. Distribution of MgO values in Hole 1160B.
F25. Variations in Zr/Ba vs. Ba content of basaltic glass and variations in Na2O/TiO2 values vs. MgO content of 0- to 7-Ma basaltic glass.
F26. Leg 187 shipboard glass analyses in relation to the 0- to 7-Ma data fields.
F27. Site locations in relation to seafloor isochrons.
F28. Site locations in relation to the residual depth anomaly and SeaBeam bathymetry.
T1. Coring summary, Leg 187.
T2. Igneous petrology summary.