Figure
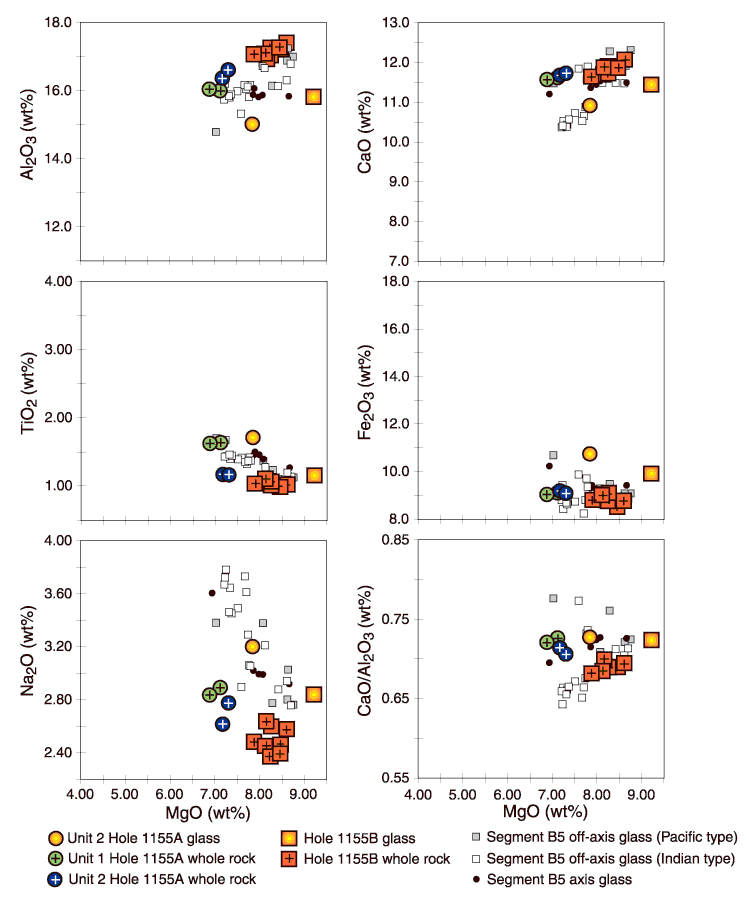
F23. Major element
compositions vs. MgO for basalts from Holes 1155A and 1155B compared with
Southeast Indian Ridge glasses from Segment B5. X-ray fluorescence (XRF) and
ICP-AES data for splits of a single whole-rock powder are shown on all plots.
Two points represent each type of analysis for one sample. Only the average XRF
or ICP-AES analyses reported in Table T3
are plotted. The analytical bias between XRF and ICP-AES is most pronounced for
Na2O.


![]()