![]() Figures F1-F12
Figures F1-F12
![]() Tables
T1-T9
Tables
T1-T9
F1. Coring and depth intervals.
F2. Examples of numbered core sections.
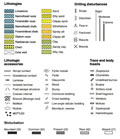
F3. Key to symbols used in the barrel sheets.
F4. Whole-rock composition and siliciclastic classification schemes.
F5. Planktonic foraminiferal bioevents and zonal schemes.
F6. Diatom species ranges.
F7. Tentative correlation between the siliceous microplankton and dinoflagellate zonal schemes and geochronologic scale.
F8. Magnetic orientation convention.
F9. Portions of the GRA bulk density records.
F10. Wireline tool strings used during Leg 189.
F11. The dipole shear sonic imager.
F12. Schematic diagram of the Formation MicroScanner.
T1. Ages of calcareous nannofossil bioevents.
T2. Ages of planktonic foraminiferal bioevents.
T3. Ages of diatom bioevents.
T4. Ages of radiolarian bioevents.
T5. Composite depth section.
T6. Splice tie points.
T7. Relative standard deviations for analysis of dissolved species.
T8. Wireline tool strings used and properties measured.
T9. Acronyms used for the wireline tool strings and their measurements.