![]() Figures
F1-F5
Figures
F1-F5
![]() Tables T1-T3
Tables T1-T3
F1. Permeability measurement.
F2. Permeability values and effective pressure.
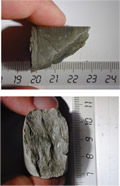
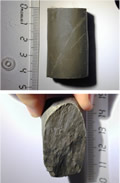
F3. Sample 190-1173A-55X5, 135–150 cm (horizontal).
F4. Evolution of confining and pore pressures.
F5. Sample 190-1173A-55X5, 135–150 cm (vertical).
T1. Sample characteristics and estimated in situ overburden stress.
T2. Permeability values and stress, strain conditions.
T3. Determination of friction coefficients.