![]() Figures F1-F34
Figures F1-F34
![]() Tables
T1-T20
Tables
T1-T20
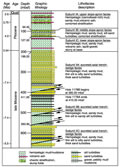
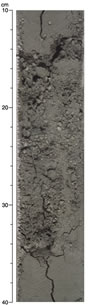
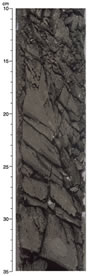
F1. Stratigraphic column.
F2. Graded volcanic ash layer from Subunit IA.
F3. Inclined volcanic ash layer in disturbed zone of Subunit IA.
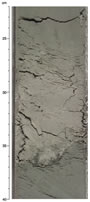
F4. Mud-supported gravel with mud and shell fragments from Subunit IB.
F5. Gravel with pumice fragments and mud clasts from Subunit IB.
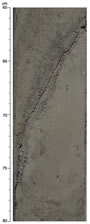
F6. Cross-lamination in a thin-bedded sandy turbidite.
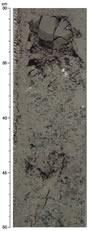
F7. Silty sand with wood fragments from Subunit IIA.
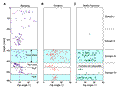
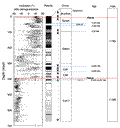
F8. Abundances of total clay minerals, quartz, plagioclase, and calcite.
F9. Synopsis of deformation structures.
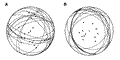
F10. Stereographic projections of bedding.
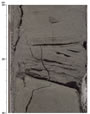
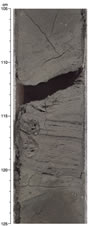
F11. Incipient breccia with irregular fine black seams.

F12. Incipient weblike structure in fine sand.
F13. Stereographic projections of structural features in Domain III.
![]()
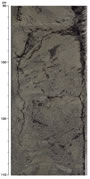
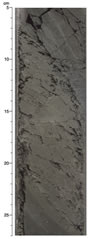
F14. Bedding-oblique foliation typical of Domain III.
F15. Trapezoidal fragments in breccia generated by oblique fracture sets.
F16. Stereographic projections of structural features in Domain IV.
![]()
F17. Incipient weblike structure in fine sand.

F18. Incipient scaly and foliated clays with fine black seams crosscutting the fracture fabric.

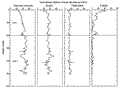
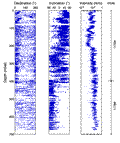
F19. Paleomagnetic declination, inclination, and intensity, Holes 1178A and 1178B.
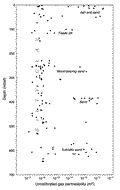
F20. Uncalibrated gas-permeameter measurements.
F21. Magnetostratigraphy.
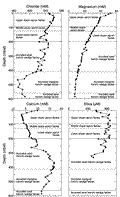
F22. Pore fluid composition as a function of depth.
F23. Total organic carbon (TOC) and sulfur concentrations.

F24. Bernard ratios.
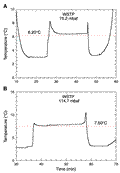
F25. Depth distribution of total bacterial populations in sediment samples.

F26. Bulk density, grain density, and porosity.

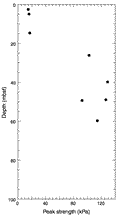
F27. Undrained peak shear strength.
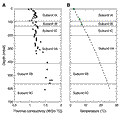
F28. Thermal conductivity and temperature trends.
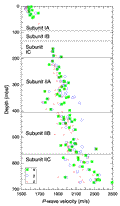
F29. P-wave velocity.
F30. Formation factor and anisotropy of electrical conductivity.

F31. Magnetic susceptibility.

F32. Temperatures measured during the deployment of the WSTP temperature tool.
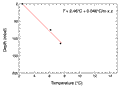
F33. Temperature vs. depth.
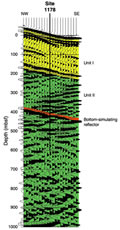
F34. Three-dimensional seismic reflection line 278.
T1. Coring summary.
T2. Coring summary by section.
T3. Stratigraphic relations.
T4. Peak intensities and peak areas from XRD analysis of sediments.
T5. Mineral abundances based on XRD analysis.
T6. Structural data.
T7. Recognized nannofossil events.
T8. Interval and depth constraints of calcareous nannofossil events.
T9. Epoch boundaries.
T10. Calcareous nannofossil range chart.
T11. Results of magnetostratigraphic identification.
T12. Pore fluid composition.
T13. Headspace gas and vacutainer analysis.
T14. Carbon, nitrogen, sulfur, and hydrogen analyses.
T15. Total bacterial populations in sediments.
T16. Comparison of surface sediment bacterial populations.
T17. Drilling fluid intrusion estimated based on PFT experiments.
T18. Fluorescent microsphere tracer experiments.
T19. Electrical conductivities and formation factor data obtained for cube samples.
T20. Formation factor data from the needle-probe method.