![]() Figures F1-F50
Figures F1-F50
![]() Figures
F51-F95
Figures
F51-F95
![]() Tables
T1-T16
Tables
T1-T16
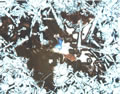
F51. Skeletal plagioclase laths in groundmass.
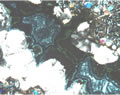
F52. Basalt with variolitic texture around phenocrysts.
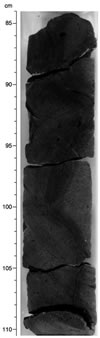
F53. Pillow interior, Sample 192-1183A-60R-1.
F54. Pillow interior, Sample 192-1183A-67R-1.
F55. Subtrachytic texture.
F56. Compositional zonation in plagioclase from a xenolith.
F57. Clinopyroxene crystal in xenolith.

F58. Plagioclase-rich xenoliths.

F59. Interstitial material in xenolith.
F60. Clinopyroxene at edge of plagioclase-rich xenolith.
F61. Phenocrysts of clinopyroxene, olivine, and plagioclase.
F62. Clinopyroxene-plagioclase glomerocryst in groundmass.
F63. Clinopyroxene xenocryst.

F64. Plagioclase glomerocrysts.
F65. Total alkalies vs. silica.

F66. Zr vs. TiO2.
F67. TiO2 vs. Mg#.

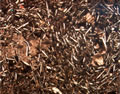
F68. Basement rock color distribution.
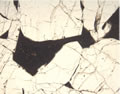
F69. Alteration front between (black) halo and (gray) interior.
F70. Olivine pseudomorph and miarolitic void filled with saponite.
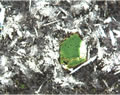
F71. Euhedral olivine pseudomorph in basalt interior.

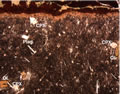
F72. Black halos on sides of hairline vein filled with smectite.
F73. Black halos on sides of vertical vein.
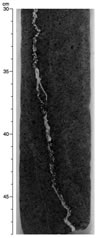
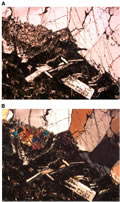
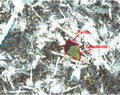
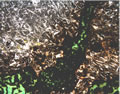
F74. Euhedral olivine (celadonite) pseudomorph in black halo.
F75. Euhedral olivine (celadonite and pyrite) pseudomorph in black halo.
F76. Euhedral olivine pseudomorphs in pillow basalt interior.
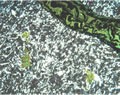
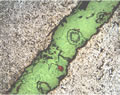
F77. Olive halos on sides of vein.
F78. Vein filled with goethite and celadonite.
F79. Vein-mineral distribution with depth.
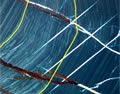
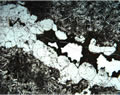
F80. Calcite vein with chalcedony and quartz (plane-polarized light).

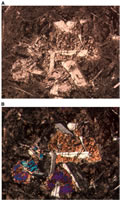
F81. Calcite vein with chalcedony and quartz (crossed polars).

F82. Calcite vein (plane-polarized light).
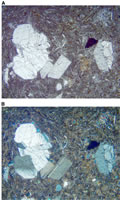
F83. Calcite vein (crossed polars).
F84. Vein-width distribution with depth.
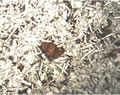
F85. Miarolitic cavities filled with smectite and calcite.

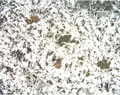
F86. Miarolitic cavity filled with nontronite and celadonite.
F87. Graph of true dip, fracture density, and vein abundance.
F88. Zijderveld diagrams for sediments and basalts.
F89. Magnetic susceptibility and NRM variations for sedimentary units.
F90. Magnetic polarity and biostratigraphic data and correlation with polarity timescale.
F91. Remanent magnetization variation.
F92. Paleolatitude vs. age.
F93. Declination and inclination variations and NRM intensity.
F94. Index properties and thermal conductivity vs. depth.
F95. Whole-core measurements vs. depth.
T1. Site 1183 coring summary.
T2. Expanded coring summary.
T3. Lithologic unit characteristics.
T4. Components of sediments.
T5. Depth-age summary.
T6. Unconformity depths and estimated durations.
T7. HO and LO of Cenozoic foraminifers and nannofossils.
T8. HO and LO of Cretaceous foraminifers and nannofossils.
T9. Relative paleobathymetric trend.
T10. Basement unit boundaries and thicknesses.
T11. Geochemical data for rock samples from Hole 1183A.
T12. Average NRM intensity and magnetic susceptibility for subunits, Hole 1183A.
T13. Properties of basalt pieces.
T14. Index properties, Hole 1183A.
T15. P-wave velocity, Hole 1183A.
T16. Thermal conductivity values, Hole 1183A.
![]() Figures F1-F50
Figures F1-F50
![]() Figures
F51-F95
Figures
F51-F95
![]() Tables
T1-T16
Tables
T1-T16