![]() Figures
F1-F11
Figures
F1-F11
![]() Tables T1-T3
Tables T1-T3
F1. Queensland and Marion Plateaus.
F2. Seismic profile through the SMP.
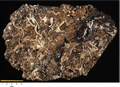
F3. Dredged ferromanganese crust.
F4. Thin section from surface hardground.
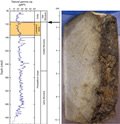
F5. Location of subsurface crust in NGR log.
F6. Beryllium plots.
![]()
F7. Seismic profile through the NMP.
F8.  Nd profile.
F9. Abundance of Fe, Mn, Co, Ni, and Cu.
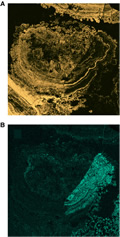
F10. Electron microprobe elemental maps.
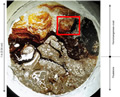
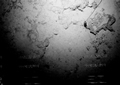
F11. Seafloor photograph of hardground.
T1. Sample locations.
T2. Measured Be concentrations.
T3. Elemental concentrations.