![]() Figures F1-F43
Figures F1-F43
![]() Tables
T1-T15
Tables
T1-T15
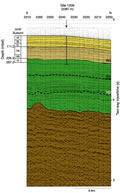
F1. Interpretation of seismic reflection profile, Site 1209.
F2. Coring results, Site 1209.
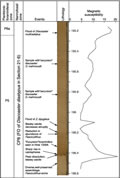
F3. Paleontological summary of the PETM interval.
F4. Paleontological summary of K/T boundary, Holes 1209A and 1209C.
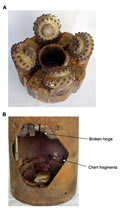
F5. Damaged bit and LFV.
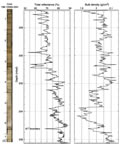
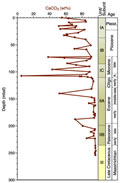
F6. Core recovery, lithologic units, age with corresponding biostratigraphic zonations, color reflectance, and percent carbonate.
F7. Magnetic susceptibility and color reflectance red/blue ratio, Hole 1209B.
F8. Estimates of biosiliceous material from smear slides, Hole 1209A.
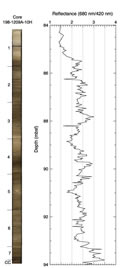
F9. Composite digital photograph and color reflectance red/blue ratio, Core 198-1209A-10H.
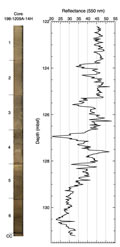
F10. Composite digital photograph and color reflectance, Core 198-1209A-14H.
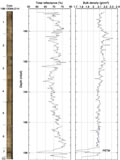
F11. Composite digital photograph, color reflectance, and bulk density, Core 198-1209A-21H.
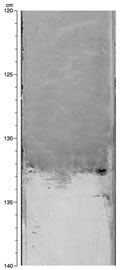
F12. Contact between clay-poor and clay-rich sediment at the base of the Paleocene.
F13. Needles of inorganic calcite dispersed within nannofossil ooze.
F14. Composite digital photograph, color reflectance, and bulk density, Core 198-1209A-25H.
F15. Total reflectance and magnetic susceptibility for a middle Eocene interval.
F16. Archive-half magnetization intensities after AF demagnetization at peak fields of 20 mT, Hole 1209A.
F17. Inclination after AF demagnetization at peak fields of 20 mT, Holes 1209A and 1209B.
F18. Age-depth curve derived from magnetic stratigraphy.
F19. Magnetic susceptibility and GRA bulk density data.
F20. Magnetic susceptibility data, 135 to 157 mcd.
F21. Magnetic susceptibility data, 202 to 217 mcd.
F22. Age-depth plot of calcareous nannofossil and planktonic foraminiferal datums.
F23. Age-depth plot of Neogene calcareous nannofossil and planktonic foraminiferal datums.
F24. Age-depth plot of early Miocene-late Eocene calcareous nannofossil and planktonic foraminiferal datums.
F25. Age-depth plot of early Oligocene-late Paleocene calcareous nannofossil and planktonic foraminiferal datums.
F26. Age-depth plot of middle Eocene-Maastrichtian calcareous nannofossil and planktonic foraminiferal datums.
F27. Mass accumulation rates vs. depth and age for the Maastrichtian-Pleistocene.

F28. Carbonate profile.
F29. Alkalinity, sulfate, ammonium, phosphate, iron, and manganese profiles.
![]()
F30. Potassium, calcium, magnesium, strontium, and lithium profiles.
F31. Silica profile.
F32. Whole-core MST magnetic susceptibility.
F33. Whole-core MST GRA bulk density.
F34. Whole-core MST and discrete P-wave velocity.
F35. MST natural gamma radiation.
F36. P-wave velocities for discrete samples.
F37. Water content, porosity, and void ratio.
F38. P-wave velocities vs. wet bulk density.
F39. Whole-core thermal conductivity.
F40. Whole-core thermal conductivity vs. discrete porosity values.
F41. Example Adara temperature data.
F42. Adara temperature measurements vs. depth.
F43. Wet bulk, dry, and grain density vs. depth, Holes 1209A and 1209B.
T1. Coring summary.
T2. Calcareous nannofossil datums, ages, and depths.
T3. Planktonic foraminifer datums, ages, and depths.
T4. Cenozoic and Cretaceous benthic foraminifers, Hole 1209A.
T5. Cenozoic and Cretaceous benthic foraminifers, Hole 1209C.
T6. Composite depth section.
T7. Splice tie points.
T8. Linear sedimentation rate segments and average accumulation rates.
T9. Headspace CH4 concentrations.
T10. Carbonate contents.
T11. Results of geochemical analyses.
T12. Discrete index properties measurements.
T13. Discrete measurements of P-wave velocity.
T14. Discrete measurements of thermal conductivity.
T15. In situ Adara temperature tool measurements.