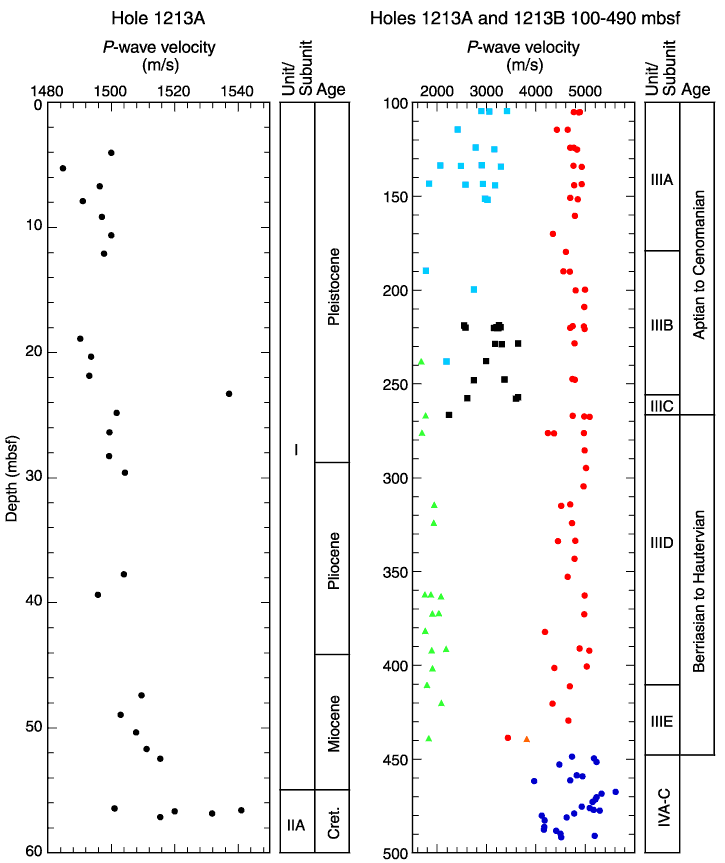
Figure F37. P-wave velocities for discrete samples from Holes 1213A and 1213B (see Table T18 for data). Blue squares = porcellanite, black squares = radiolarite, green triangles = chalk and limestone, red circles = chert, blue circles = diabase, orange triangle = hydrothermally altered sediment.


![]()