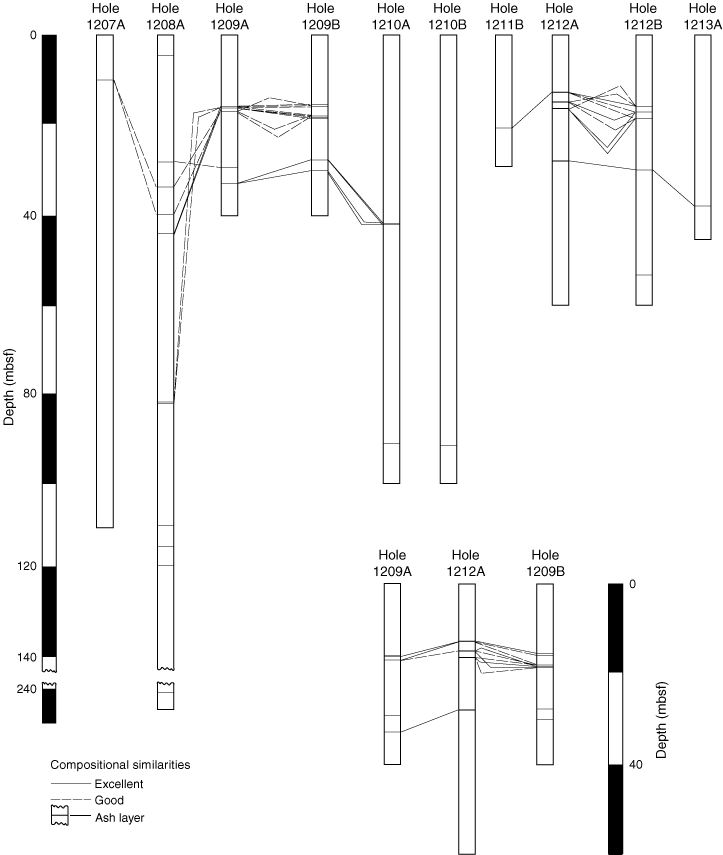
Figure F10. Chart showing excellent and good compositional similarities based on data in Table T4. Degree of similarity is keyed to "Total Percentage" values in Table T4. See text and Figure F8
for explanation of correlation method. Note that moderate and poor correlations are not shown.