![]() Figures F1-F21
Figures F1-F21
![]() Tables
T1-T17
Tables
T1-T17
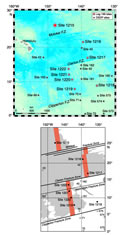
F1. Site location map.
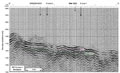
F2. Seismic reflection profile.
F3. Lithologic summary.

F4. Distribution of biostratigraphic zones and datum events.

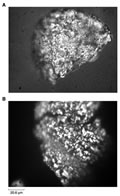
F5. Test walls of Abyssamina quadrata.
F6. Magnetization intensities after AF demagnetization.

F7. Comparison of uncorrected and corrected declinations.
F8. AF demagnetization of a discrete sample.
F9. Magnetic stratigraphy.
F10. GRA bulk density, MS, color reflectance, and P-wave velocity data plotted vs. composite depth.
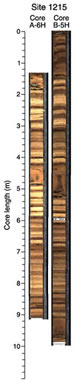
F11. Line-scan composite digital images.
F12. Spliced data sets for GRA bulk density, MS, color reflectance, and P-wave velocity plotted vs. composite depth.

F13. Plot of biostratigraphic and paleomagnetic datum levels vs. depth.
F14. Interstitial water geochemical data.
F15. Bulk sediment geochemical data.
F16. Moisture and density measurements.

F17. Dry and wet bulk density vs. GRA bulk density.
F18. LAS mineralogy determinations.

F19. Compressional wave velocity and transverse velocity measurements.

F20. Thermal conductivity as a function of porosity.

F21. NGR and MS.
T1. Coring summary.
T2. Distribution of calcareous nannofossil datums.
T3. Distribution of planktonic foraminifers.
T4. Distribution of benthic foraminifers.
T5. Composite depth table.
T6. Core disturbance table.
T7. Splice tie point table.
T8. Paleomagnetic datums.
T9. Nannofossil and foraminifer events.
T10. LSRs and MARs for the major lithologic units.
T11. Interstitial water data.
T12. Bulk sediment data.
T13. CaCO3 and organic carbon data.
T14. Moisture and density measures.
T15. LAS mineralogy determinations.
T16. Split-core velocity measurements.
T17. Thermal conductivity.