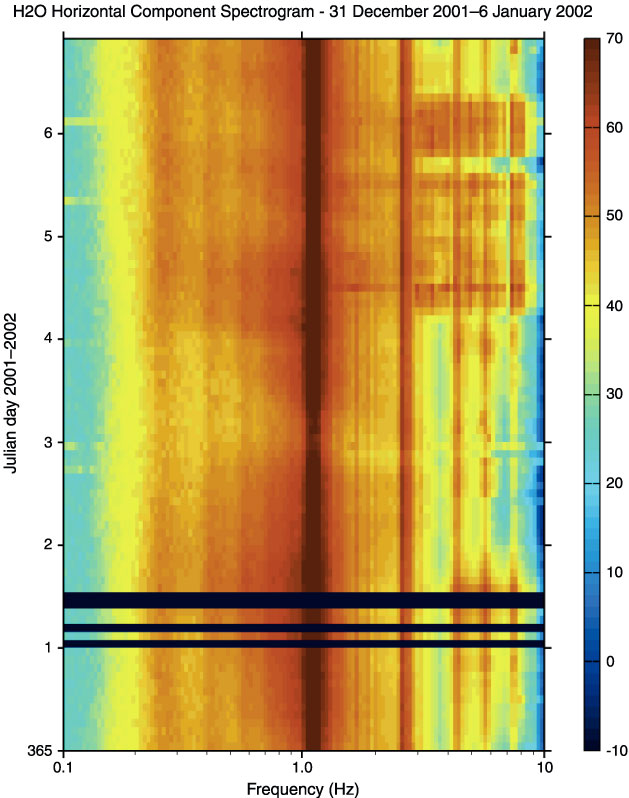
Figure F90. Spectrogram summary of ambient noise levels on the horizontal component of the Hawaii-2 Observatory (H2O) seafloor seismometer for the 1-week interval from 31 December 2001 to 6 January 2002. Color, as defined in the bar on the right, indicates the relative energy content in decibels relative to counts squared per hertz as a function of frequency from 0.1 to 10 Hz. By comparing this horizontal component with the vertical component in Figure F89 one can see many more constant frequency bands. The main sediment resonances at 1.1 and 2 Hz dominate even the microseism peak near 0.2 to 0.3 Hz. The red blotches from 4.2 to 6.2 days at frequencies from 2 to 9 Hz correspond to drilling with the RCB bit. The horizontal dark-blue bands on 1 January are data dropouts.