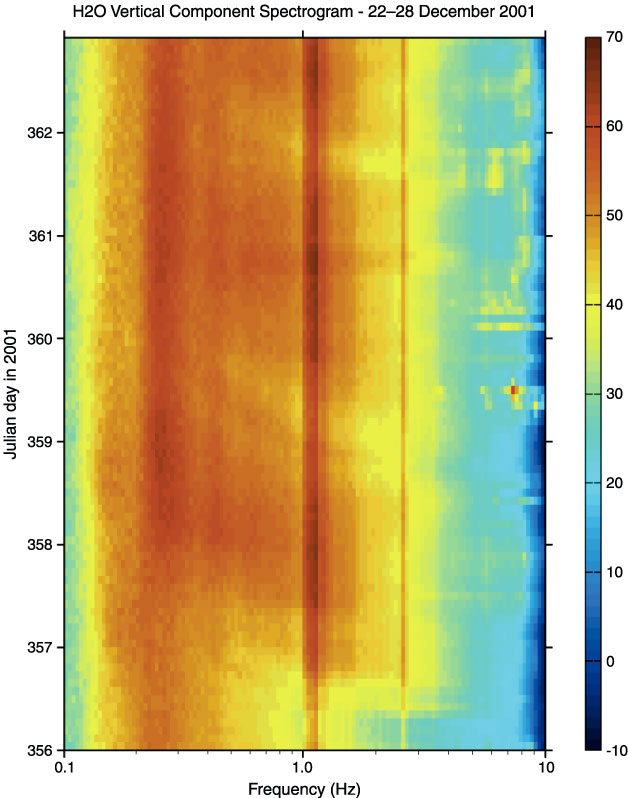
Figure F89. Spectrogram summary of ambient noise levels on the vertical component of the Hawaii-2 Observatory (H2O) seafloor seismometer for the 1-week interval from 22 to 28 December. Color, as defined in the bar on the right, indicates the relative energy content in decibels relative to counts squared per hertz (from -10 to 70 dB) as a function of frequency from 0.1 to 10 Hz. The broad red band at ~0.2-0.3 Hz throughout the week is the microseism peak generated by wave-wave interaction of ocean gravity waves. The thinner red bands at 1.1 and 2.0 Hz are resonances in the thin sediment cover at this site. This spectrogram also shows two and a half storm cycles. These are the broad red bands that slope upward to the left from ~1 to 0.2 Hz over 1.5 to 2 days for each storm cycle. The high-energy peak at 8 Hz, on 25 December (Julian day 359), is a passing ship (see Fig. F96). The JOIDES Resolution arrived on site at 1500 hr on 26 December (Julian day 360). The patches of yellow from 4 to 9 Hz on 26-29 December (Julian days 360 to 363) can be associated with JOIDES Resolution activities (also see Figs. F90, F92, F93, F96, F97).