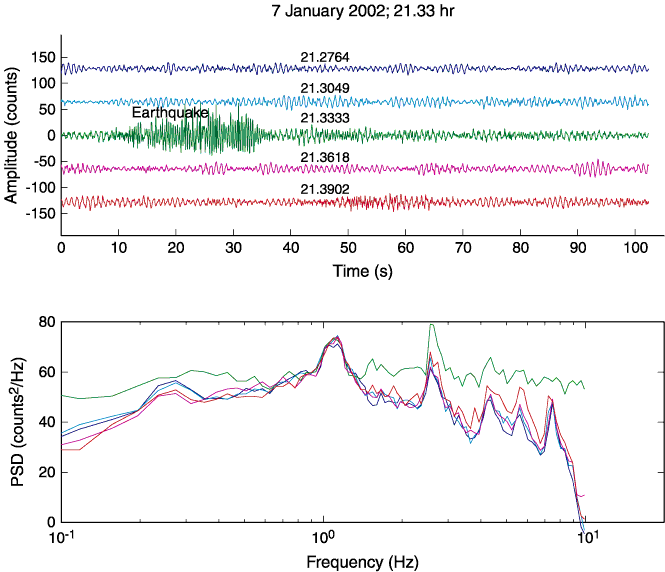
Figure F94. The top panel shows time series near the earthquake at 21.3333 hr in Figure F93. The earthquake occurs between 10 and 35 s on the middle trace. The bottom panel shows the corresponding color-coded power spectral density (PSD) in counts squared per hertz. The microseism peak level is unchanged, but levels above the microseism peak increase by up to 20 dB.