![]() Figures
F1-F6
Figures
F1-F6
![]() Tables T1-T2
Tables T1-T2
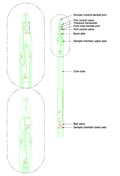
F1. Schematic of the PCS.
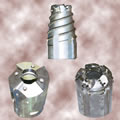
F2. New cutting shoes.
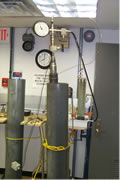
F3. Degassing the PCS.
F4. Time-pressure plots for trial runs.
F5. Time-pressure plots, Site 1230.
F6. Volume-pressure plots, Site 1230.
T1. PCS operations.
T2. Composition of gas released from the PCS.