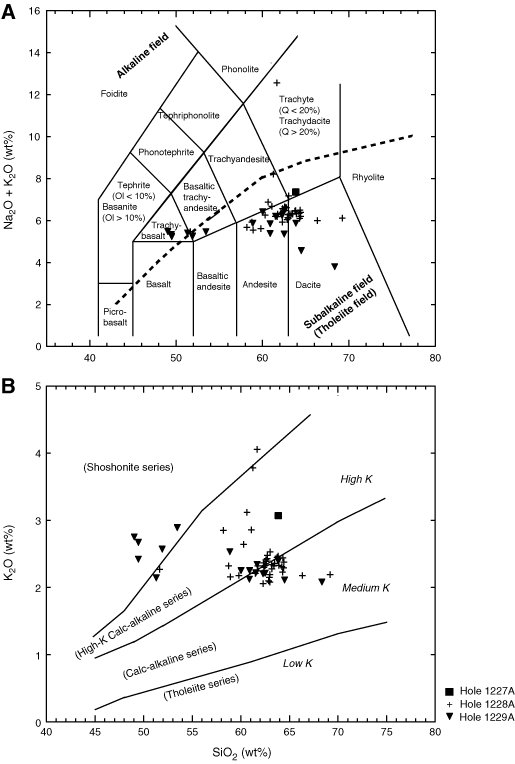
Figure F9. (A) TAS covariation diagrams and (B) potassium vs. silica for Leg 201 whole-rock analyses. The TAS plot displays the Irvine and Baranger (1971) alkaline/subalkaline (tholeiitic) division line (dashed line). Nomenclature and subdivisions as in Figure F6.