![]() Figures F1-F19
Figures F1-F19
![]() Tables
T1-T13
Tables
T1-T13
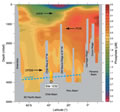
F1. Site location and oceanographic features off southern and central Chile.
F2. Seismic profile at Site 1232.

F3. North-south cross section of water masses.
F4. Magnetic susceptibility vs. depth for the spliced record.
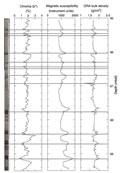
F5. Spliced records of L*, NGR, GRA density, and MST-MS.
F6. Mcd vs. mbsf.
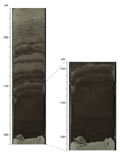
F7. Typical interbedded sequence.
F8. Basal depth and thickness of coarse-grained layers.
F9. Mineralogy acquired from smear slide data.
F10. Lithostratigraphic summary.
F11. Moisture and density.
F12. GRA and MAD bulk density.
F13. Color measurements.
F14. Coarse layer characteristics.
F15. NRM before and after 20-mT demagnetization.
F16. NRM compared among Holes 1232A, 1232B, and 1232C.
F17. NRM vs. whole-core low-field MS.
F18. Headspace methane vs. depth.
F19. Interstitial water geochemical data.
T1. Operations summary.
T2. Composite depth scale.
T3. Splice tie points.
T4. OSUS-MS measurements, Hole 1232A.
T5. OSUS-MS measurements, Hole 1232B.
T6. Lithologic Unit I.
T7. Coarse-grained layers.
T8. Distribution of calcareous nannofossils.
T9. Distribution of foraminifers.
T10. Distribution of diatoms.
T11. Headspace gas concentrations.
T12. Interstitial water geochemical data.
T13. IC, CaCO3, TC, TOC, TN, and TOC/TN ratios.