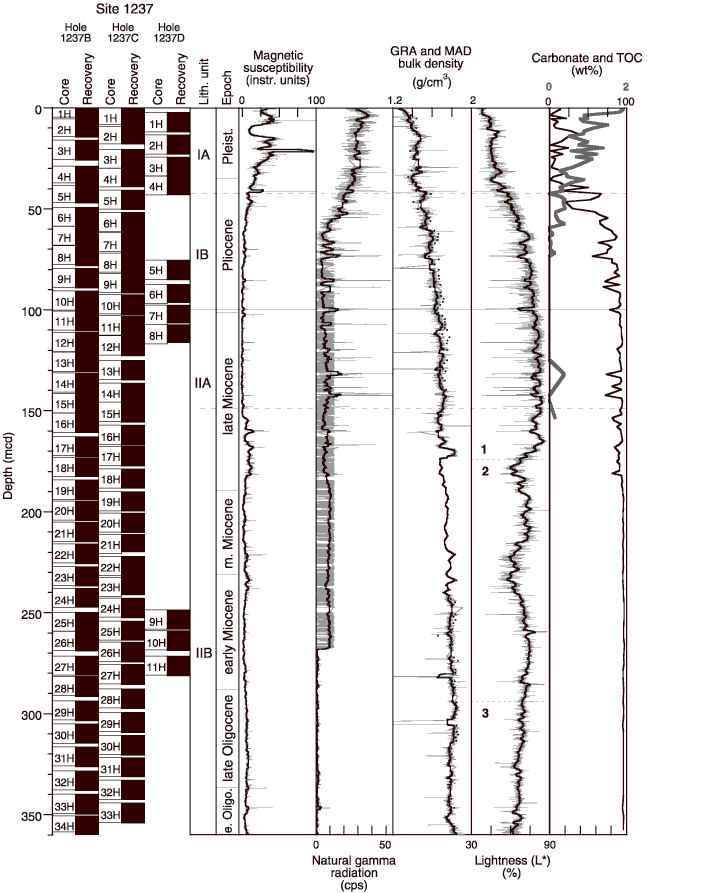
Figure F11. Core recovery, lithostratigraphy, epoch, magnetic susceptibility, natural gamma radiation (Hole 1237B only), gamma ray attenuation (GRA) and moisture and density (MAD; dots), bulk density (Hole 1237B only), grain density, L*, and calcium carbonate and total organic carbon (TOC) (Hole 1237B only) of recovered sediments from Site 1237. For MS, NGR, GRA, and L*, gray curves represent the original measured data and black curves indicate a 50-point running average of the original data. Interpolated bulk densities from MAD measurements are provided between ~170 and 240 mcd on the GRA density curve. Dashed lines across the a*, b*, and L* profiles indicate boundaries between three color populations shown in Fig. F13. At right, CaCO3 is the black line and TOC is the gray line. Lines = GRA density, dots = MAD density.


![]()