![]() Figures F1-F20
Figures F1-F20
![]() Figures
F21-F36
Figures
F21-F36
![]() Tables
T1-T13
Tables
T1-T13
F21. IC, OC, TN, and TS.
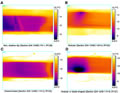
F22. Hydrate IR thermal anomalies.
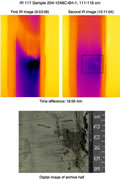
F23. IR images.
F24. Downhole temperature.
F25. IR thermal anomalies with Sw.
F26. Physical properties.
F27. LWD, GRA, MAD, grain density, and MS.

F28. NCR.
F29. Gas hydrate dissociation experiment.
F30. Temperature time series.

F31. Estimated temperature.

F32. Quality control LWD logs.
F33. LWD log data.

F34. LWD- and core-derived porosities.
F35. Log-derived gas hydrate saturations, Hole 1248A.

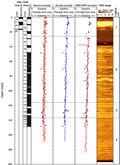
F36. RAB image, Hole 1248A.

T1. Coring summary.
T2. Location of sampled carbonate nodules.
T3. Bioevents.
T4. Dissolved species in pore waters.
T5. C1, C2, C2=, and C3.
T6. Light hydrocarbon and nonhydrocarbon gases.
T7. Light hydrocarbon and nonhydrocarbon gases in gas hydrates.
T8. IC, OC, TN, and TS, and C/N ratios.
T9. Rock-Eval pyrolysis.
T10. Presence of gas hydrate based on IR images.
T11. MAD values.
T12. Thermal conductivity values.
T13. Temperature measurements.
![]() Figures F1-F20
Figures F1-F20
![]() Figures
F21-F36
Figures
F21-F36
![]() Tables
T1-T13
Tables
T1-T13