![]() Figures F1-F20
Figures F1-F20
![]() Figures
F21-F36
Figures
F21-F36
![]() Tables
T1-T13
Tables
T1-T13
F1. Bathymetric map.

F2. Lithostratigraphic summary.

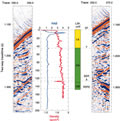
F3. Seismic reflection profile and LWD data.
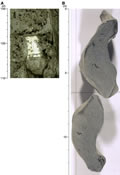
F4. Sediment textures related to hydrate dissociation.

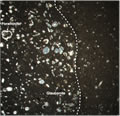
F5. Carbonate nodule with mousselike sediments and a carbonate nodule.
F6. Carbonate nodule.
F7. XRD records showing a decrease in calcite.
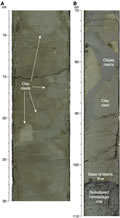
F8. Debris flow deposits.
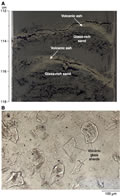
F9. Volcanic ash- and glass-rich sand layers.
F10. Diatom and nannofossil event marker species.
F11. Age-depth plot.

F12. Various dissolved species.
F13. Chloride concentration profile.

F14. Interstitial sulfate and barium.
F15. Interstitial dissolved boron and strontium concentrations.

F16. C1, C2, and C3.

F17. C1, C2, C3, i-C4, and n-C4.
F18. Light hydrocarbons.
F19. C1/C2 ratio vs. depth.
F20. C1/C2 ratio vs. temperature.