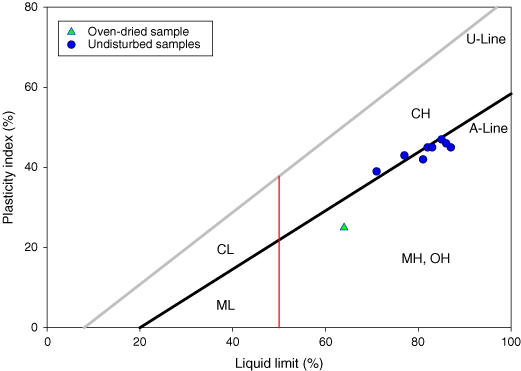
Figure F1. Plasticity chart showing results of Atterberg limits on undisturbed and oven-dried samples (data from Table T4). CL = low-plasticity clay, CH = high-plasticity clay, ML = low-plasticity silt, MH = high-plasticity silt, OH = high-plasticity organic soil.


![]()