![]() Figures F1-F20
Figures F1-F20
![]() Figures
F21-F40
Figures
F21-F40
![]() Figures
F41-F60
Figures
F41-F60
![]() Figures
F61-F80
Figures
F61-F80
![]() Figures
F81-F94
Figures
F81-F94
![]() Tables
T1-T15
Tables
T1-T15
F61. P-wave velocity and porosity.
F62. Corrected MST NGR measurements.
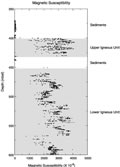
F63. Volumetric magnetic susceptibility.
F64. Paleomagnetic results, Hole 1253A.
F65. NRM after 20-mT AF demagnetization.
F66. SIRM and Lowrie's tests.
F67. Magnetic domain state above 400 mbsf.
F68. Zijderveld diagrams.
F69. Average inclinations.
F70. Cl, Na, Na/Cl, and K profiles.
F71. SO4, NH4, Fe, and Mn profiles.
F72. Ca, Mg, Mg/Ca, and Sr profiles.
F73. Ba, H4SiO4, Li, and B profiles.
F74. Headspace gas analyses.
F75. TOC, CaCO3, and S profiles.
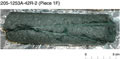
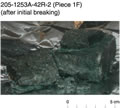
F76. Rock image used before breaking.
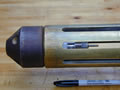
F77. Image of sample after breaking.
F78. Temperature record of an MTL.
F79. CTD profile from 2500 to 5318 mbsl.
F80. The MTL mounted in the TAP tool.
![]() Figures F1-F20
Figures F1-F20
![]() Figures
F21-F40
Figures
F21-F40
![]() Figures
F41-F60
Figures
F41-F60
![]() Figures
F61-F80
Figures
F61-F80
![]() Figures
F81-F94
Figures
F81-F94
![]() Tables
T1-T15
Tables
T1-T15