![]() Figures F1-F20
Figures F1-F20
![]() Figures
F21-F40
Figures
F21-F40
![]() Figures
F41-F50
Figures
F41-F50
![]() Tables
T1-T17
Tables
T1-T17
F1. Bathymetric map of Leg 205 and 170 drill sites.
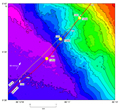
F2. Location of Site 1254.
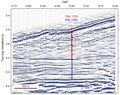
F3. Multichannel seismic profile BGR 99-44.
F4. Structural and geochemical results.
F5. Lithologic boundary between Subunits P1B and U1A.
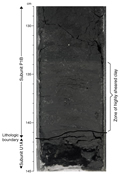
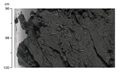
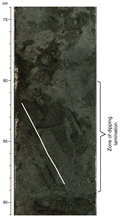
F6. Deformed hemipelagic Subunit U1A.
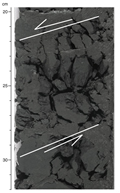
F7. Fault gouge.
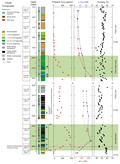
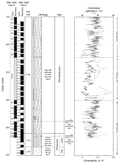
F8. Stratigraphic log, Sites 1040 and 1254.
F9. Altered volcanic ash.
F10. Recovered sediments, Site 1254.
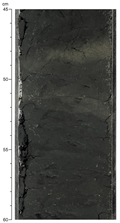
F11. Sandy interval with weakly formed parallel laminations.
F12. Smear slide data, Sites 1254 and 1040.
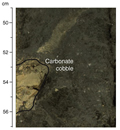
F13. Light tan cobble of limestone.
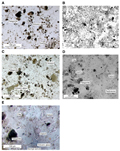
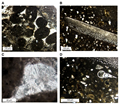
F14. Photomicrographs from a cobble of carbonate.
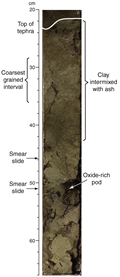
F15. Major siliceous tephra layer.
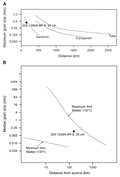
F16. Tephra grain size comparisons.
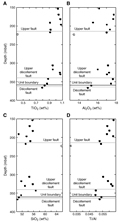
F17. Depth profiles for TiO2, Al2O3, SiO2, and Ti/Al.
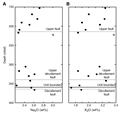
F18. Depth profiles for Na2O and K2O.
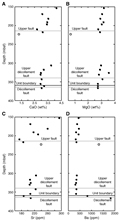
F19. Depth profiles for CaO, MgO, Sr, and Ba.
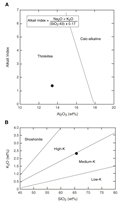
F20. Discrimination plots for tephra.
![]() Figures F1-F20
Figures F1-F20
![]() Figures
F21-F40
Figures
F21-F40
![]() Figures
F41-F50
Figures
F41-F50
![]() Tables
T1-T17
Tables
T1-T17