![]() Figures F1-F20
Figures F1-F20
![]() Figures F21-F40
Figures F21-F40
![]() Figures
F41-F53
Figures
F41-F53
![]() Tables
T1-T11
Tables
T1-T11
F41. Elemental abundance vs. MgO.

F42. Distributions of alteration types.

F43. Distribution of secondary minerals.
F44. Secondary minerals contained in veins, breccia, and interflow sediment.

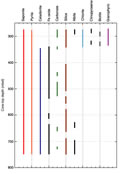
F45. Abundance of secondary mineral veins.

F46. Volume percent secondary mineral veins.

F47. Distribution of alteration zones.
![]()
F48. Measured structures.

F49. True dip values of oriented structures.

F50. Thermal demagnetization plots.

F51. AF demagnetization plots.

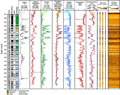
F52. Downhole logging results.
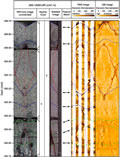
F53. Unrolled core images and FMS/UBI images.
T1. Drill holes into basement, 1968-2003.
T2. Operation acronyms.
T3. Operations summary, Leg 206.
T4. Coring summary, Site 1256.
T5. Operations summary, Site 1256.
T6. Sedimentary overburden unit summary.
T7. Calcareous nannofossil datums.
T8. Magnetostratigraphy.
T9. Igneous unit and contact log, Hole 1256C.
T10. Igneous unit and contact log, Hole 1256D.
T11. Locations of glass, Holes 1256C and 1256D.
![]() Figures F1-F20
Figures F1-F20
![]() Figures F21-F40
Figures F21-F40
![]() Figures F41-F53
Figures F41-F53
![]() Tables
T1-T11
Tables
T1-T11