![]() Figures F1-F20
Figures F1-F20
![]() Figures F21-F31
Figures F21-F31
![]() Table
T1
Table
T1
F21. TOC and C/N in black shales.
![]()
F22. Interstitial water chemical constituents.
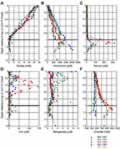
F23. Velocity and porosity profiles.
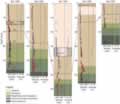
F24. Stratigraphy of the black shale interval.
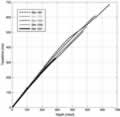
F25. Seismic traveltime vs. depth.
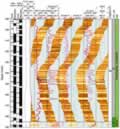
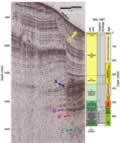
F26. Seismic profile, line GeoB220.
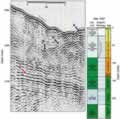
F27. Seismic profile, line GeoB221.
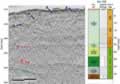
F28. Seismic profile, line GeoB219.
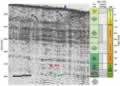
F29. Seismic profile, line GeoB215.
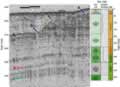
F30. Seismic profile, line GeoB213.
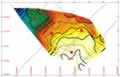
F31. Horizon C surface map.
T1. Operations summary.
![]() Figures F1-F20
Figures F1-F20
![]() Figures F21-F31
Figures F21-F31
![]() Table
T1
Table
T1