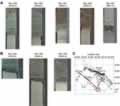
![]() Figures F1-F20
Figures F1-F20
![]() Figures F21-F31
Figures F21-F31
![]() Table
T1
Table
T1
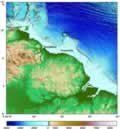
F1. Regional location map.
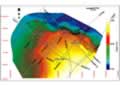
F2. Seismic survey track lines over bathymetry.
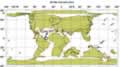
F3. Paleogeographic reconstruction of the Late Cretaceous.
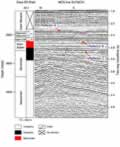
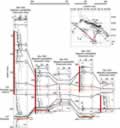
F4. Stratigraphy of line A2-1 vs. line SU7657A.
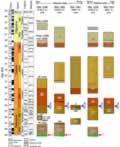
F5. Major evolutionary events.
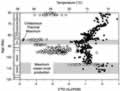
F6. Cretaceous  18O temperature records.
F7. Cenozoic events.
F8. Major breaks in sedimentation.
F9. P/E and K/T boundary intervals.
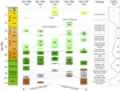
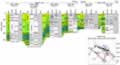
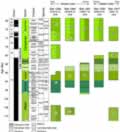
F10. Paleogene biostratigraphic summary.
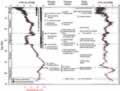
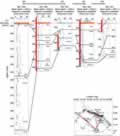
F11. Paleogene stratigraphy and lithology.
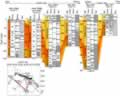
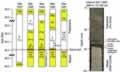
F12. Cretaceous biostratigraphic summary.
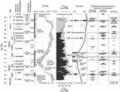
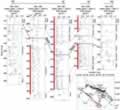
F13. Cretaceous stratigraphy and lithology.
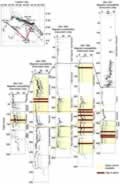
F14. Late Maastrichtian–Danian record.
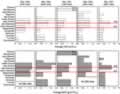
F15. Summary of LSRs and MARs.
F16. Magnetic susceptibility profiles.
F17. Paleocene–lower Eocene magnetic susceptibility.
F18. Campanian–Maastrichtian magnetic susceptibility.
F19. GRA bulk density profiles.
F20. Hydrogen index and Tmax values.
![]()
![]() Figures F1-F20
Figures F1-F20
![]() Figures F21-F31
Figures F21-F31
![]() Table
T1
Table
T1