![]() Figures F1-F20
Figures F1-F20
![]() Figures
F21-F31
Figures
F21-F31
![]() Tables
T1-T21
Tables
T1-T21
F21. Summary of logging runs.
F22. Borehole caliper logs.
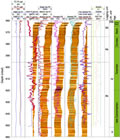
F23. Geophysical logs and core physical properties.
F24. Geophysical logs and caliper data.
F25. MGT gamma ray logs.
F26. MGT and core gamma ray data.
F27. Triple combo logs and FMS imagery.
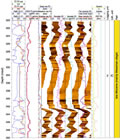
F28. Stratigraphy of the black shales.
F29. Core-measured vs. log-calculated TOC.

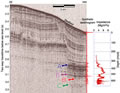
F30. Density, velocity, impedance, and reflection profiles.
F31. Reflectors, synthetic seismogram, and impedance profile.
T1. Coring summary.
T2. Summary of lithology.
T3. Calcareous nannofossils.
T4. Planktonic foraminifers, Hole 1261A.
T5. Planktonic foraminifer datums.
T6. Datum levels, ages, and preservation of samples.
T7. Planktonic foraminifers, Hole 1261B.
T8. Polarity and characteristic directions.
T9. Composite depth offsets.
T10. Splice tie points.
T11. Biostratigraphic datums and sedimentation rates.
T12. Campanian–Maastrichtian magnetostratigraphic datums.
T13. LSRs and MARs.
T14. Inorganic and organic carbon and total nitrogen.
T15. Rock-Eval pyrolysis analyses.
T16. Headspace analysis.
T17. Pore water analyses.
T18. MAD of discrete samples.
T19. GRA and MAD bulk density.
T20. Velocity measurements.
T21. Checkshot data.
![]() Figures F1-F20
Figures F1-F20
![]() Figures F21-F31
Figures F21-F31
![]() Tables T1-T21
Tables T1-T21