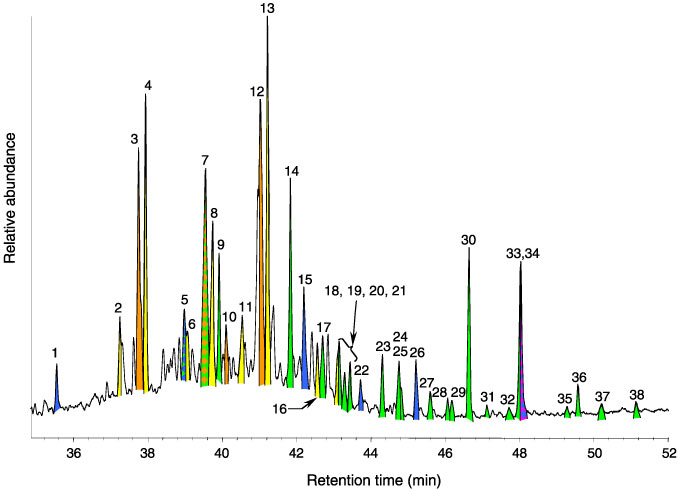
Figure F2. Biomarkers in the partial total ion chromatogram of Sample 207-1258B 55R-1, 49–50 cm. Table T4 lists identifications of compounds indicated by small numbers. Colors are used to highlight various groups of biomarkers. Blue = n-alkanes, yellow = steranes, orange = sterenes, green = hopanoids, multicolored peaks = coelution of two or more compounds.