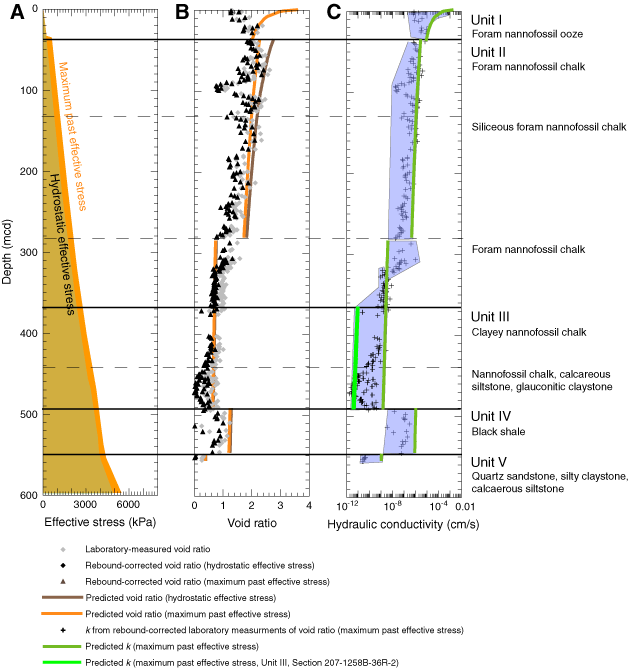
Figure F8. Effective stress, void ratio, and hydraulic conductivity profile for Site 1259. Stress history data from a near-surface Oligocene sample was used to determine the maximum past effective stress profile for the sedimentary column (Equation 19) and predict the in situ e from consolidation test results (Equation 18). At Site 1259, 300 kPa was added to the hydrostatic effective stress to predict the e of sediments using consolidation test results from sampled lithologic units at other sites (Table T1). Laboratory measurements of e (gray diamonds) were rebound corrected (Equation 17, black triangles) using the hydrostatically determined effective stress profile (Equation 5). The hydraulic conductivity of sediments was calculated in two ways: (1) by using the e-log(k) relationship for individual lithotypes on the rebound-corrected laboratory measurements of e (black stars) and (2) by applying the e-log(k) relationship to the predicted e profile (orange line) (Table T3). Often the predicted e overestimates the measured e, and thus serves as an upper bound to sediment permeability. For Unit III, an upper and lower permeability were determined by applying the e-log(k) relationship from Samples 207-1257C-6R-3, 140 cm, and 207-1258B-36R-2, 45 cm. Blue shading represents a qualitative estimate for the possible range of hydraulic conductivity within each lithologic unit.


![]()