![]() Figures F1-F20
Figures F1-F20
![]() Figures
F21-F40
Figures
F21-F40
![]() Figures
F41-F52
Figures
F41-F52
![]() Table T1-T3
Table T1-T3
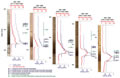
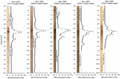
F41. Depth-scale representation of the MS record, Site 1267.
F42. Age-depth models.
F43. LSRs and total MARs.
F44. Lithostratigraphy and MARs vs. age.
F45. Carbonate contours and accumulation contours.
F46. The K/P boundary at Walvis Ridge.
F47. MS and L* data exhibiting the mid-Paleocene biotic event on Walvis Ridge.
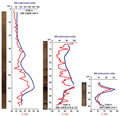
F48. MS and CaCO3 through the Paleocene–Eocene transition.
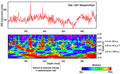
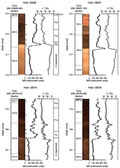
F49. MS records across the early Eocene Chron C24n clay layer.
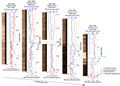
F50. Composite digital images of the Eocene–Oligocene sequence.
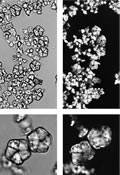
F51. Early Oligocene nannofossil assemblageshowing Braarudosphaera skeletal debris.
F52. MS records showing the HAB event interval in the early Miocene.
T1. Operations summary, Leg 208.
T2. Common age tie points for the Leg 208 sites.
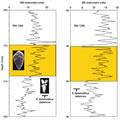
T3. Eocene–Oligocene calcareous nannofossil and planktonic foraminiferal datum levels.
![]() Figures F1-F20
Figures F1-F20
![]() Figures
F21-F40
Figures
F21-F40
![]() Figures
F41-F52
Figures
F41-F52
![]() Table T1-T3
Table T1-T3