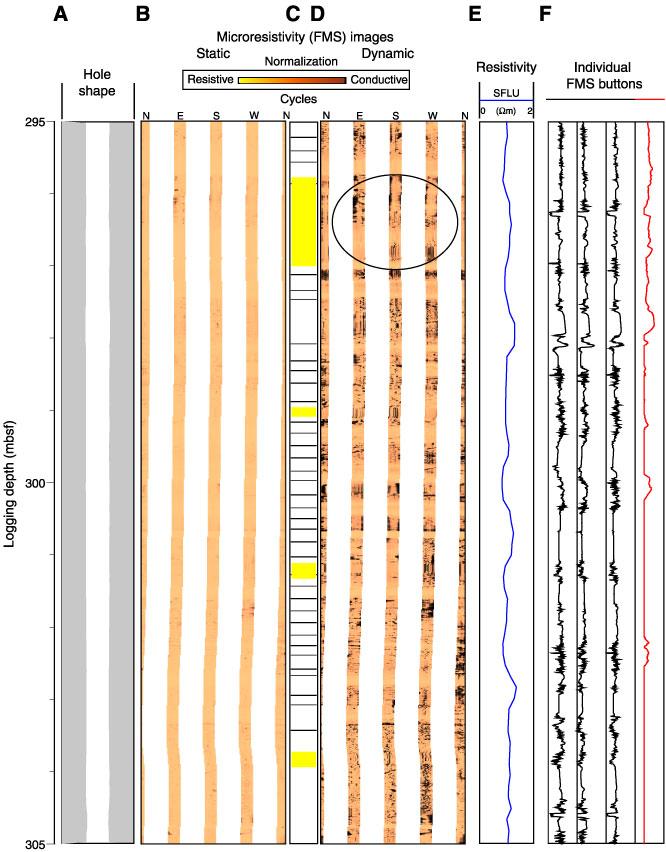
Figure F44. Formation MicroScanner images of chert layers (close-up of Fig. F43 between 295 and 305 mbsf) showing (A) hole shape, (B) static and (D) dynamic (window height = 0.5 m) normalization of the microresistivity images, (C) interpreted chert layers, (E) shallow resistivity (SFLU) logs, and (F) extracted FMS button records. Yellow rectangles = zone where stick-slip displacements occurred and impaired image quality (circled area).