![]() Figures F1-F20
Figures F1-F20
![]() Figures
F21-F28
Figures
F21-F28![]() Tables T1-T14
Tables T1-T14
F1. Locations of Site 1267 and alternate sites.
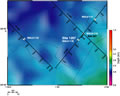
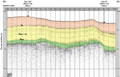
F2. Site 1267 and DSDP Site 527 along line GeoB 01-039.
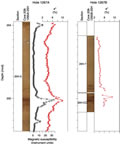
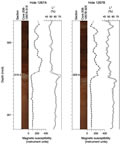
F3. MS data.
F4. Color reflectance data.
F5. Mbsf vs. mcd growth rates.
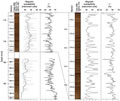
F6. MS, NGR, carbonate concentration, and L*.
F7. MS, NGR, and GRA bulk density.
F8. Lightness, carbonate, and chromaticity.
F9. Smear slide components.
F10. Grain density, bulk density, porosity, and P-wave velocity.
F11. Physical property measurements.
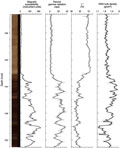
F12. Chromaticity, Mn and Fe, and grain density, Hole 1267A.
F13. Digital images and cyclic patterns of sedimentation.
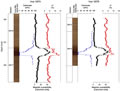
F14. Digital image, MS, NGR, and L* across the E/O boundary.
F15. Digital images, MS, carbonate, and a* across the P/E boundary.
F16. P-wave velocity across the of P/E boundary.
F17. Digital images, MS, and a* for the red clay layer.
F18. Digital images, MS, and L* of the K/P boundary.
F19. Planktonic foraminiferal and calcareous nannofossil biozonations.
F20. Sedimentation rates.