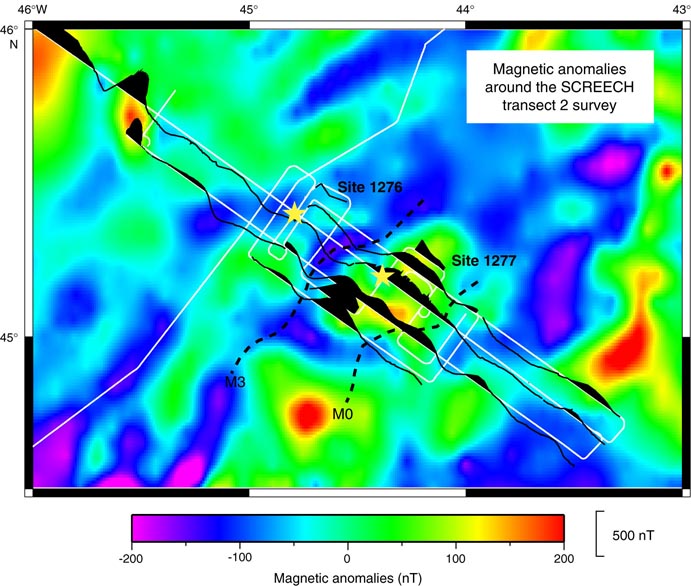
Figure F6. Color map of magnetic anomalies from the gridded data compiled by Verhoef et al. (1996). The map covers the same area as Figure F2. The SCREECH survey lines in this area are indicated in white, with magnetic anomalies plotted along the margin-normal tracks. Positive anomalies are shown in black. Yellow stars = locations of Sites 1276 and 1277. Dashed lines = locations of Anomalies M0 and M3, as identified by Srivastava et al. (2000).