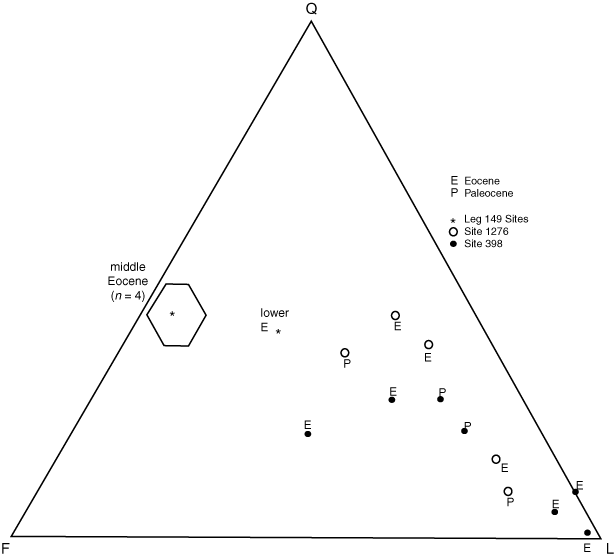
Figure F12. Ternary QFL plot of Eocene and Paleocene sandstone data from ODP Site 1276 and Iberian ODP and DSDP sites. Data for Sites 1276 and 398 are presented in Table T1. Data for Leg 149 sites taken from Marsaglia et al. (1996). Polygon for middle Eocene is field of variation created by intersection of standard deviations about the mean. Note that L pole includes sedimentary carbonate lithic fragments. Symbols for samples are keyed on the plot according to sample ages.


![]()