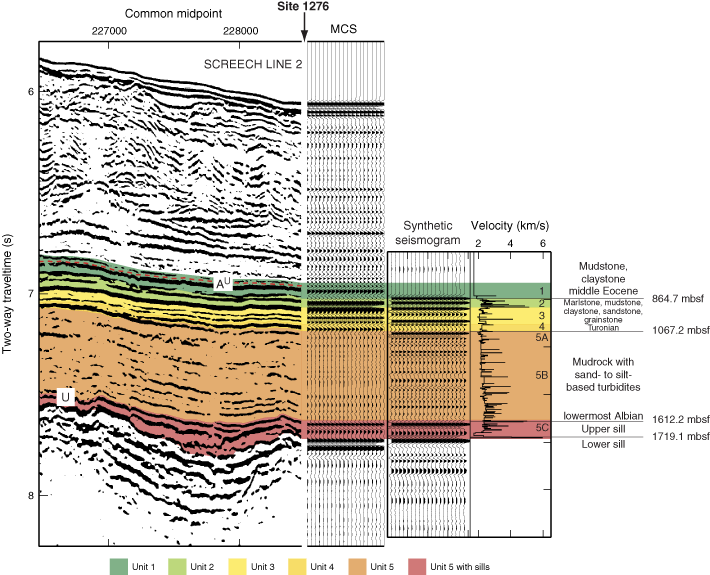
Figure F12. Interpretation of seismic horizons observed on a section of SCREECH Line 2 based on Interpretation 1 (Fig.
F10A), which uses the synthetic seismogram calculated from physical properties processing Scenario 3 (Fig. F9C). The common midpoint panel shows interpreted segment of SCREECH Line 2 multichannel seismic (MCS) data (Shillington et al., 2004) that crosses Site 1276 (indicated with an arrow at the base of the plot). The MCS panel shows individual traces from coincident MCS reflection data. The synthetic seismogram has been shifted and stretched based on synthetic seismic correlations in Interpretation 1 (Fig.
F10A). The velocity function was used for synthetic seismogram generation together with lithologic units, ages, and dominant lithologies. Red dotted line = final interpretation of the AU reflection (after Tucholke and Sibuet, this volume) described in the text.


![]()