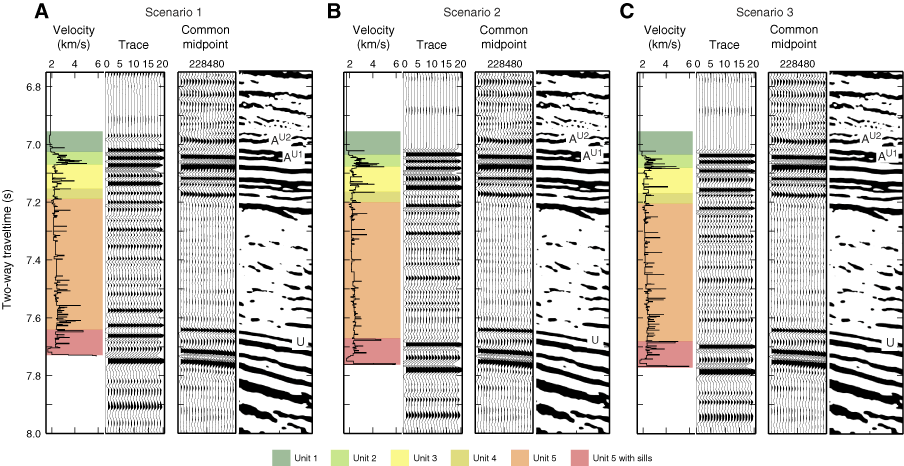
Figure F9. A–C. Synthetic seismograms calculated using the three different scenarios for processing physical property data illustrated in Figures
F4 and F6. For each scenario, the velocity function used is shown together with lithologic units (color coded by unit), and the synthetic seismogram is plotted immediately to the right. Twenty wiggle traces and 200 variable density traces from SCREECH Line 2 MCS data at Site 1276 are plotted for comparison; wiggle traces best represent observed amplitudes at the drill site. Synthetics generated for all three scenarios recover the first-order features observed in the MCS reflection data. Top of green box = top of cored interval (800 mbsf); in all cases this level is converted to TWT using velocities from modeling of MCS data between the seafloor and 800 mbsf. Reflections that appear in synthetic seismograms after the last sample are caused by interbed multiples and other effects included in the reflectivity method.


![]()