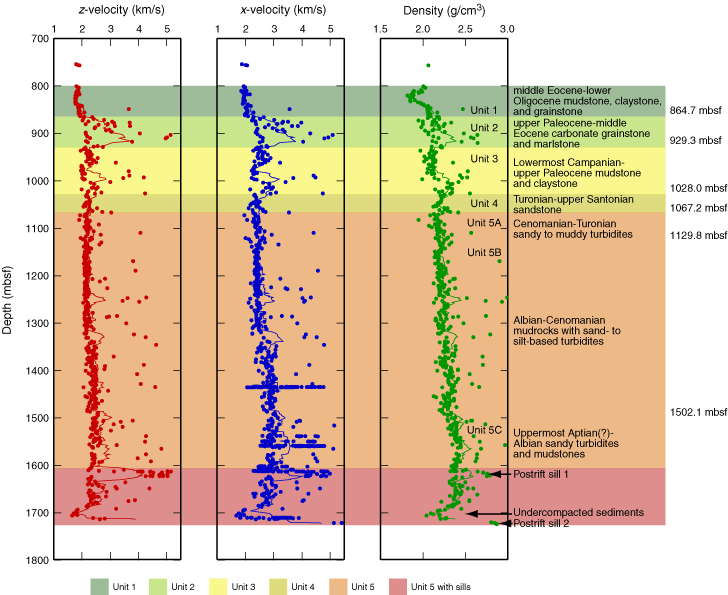
Figure F3. Laboratory measurements of vertical (z) and horizontal (x) P-wave velocity and of density made during Leg 210 at Site 1276 (Shipboard Scientific Party, 2004). Graphs do not cover the full range of measured values; complete data set is archived in the Janus database (www-odp.tamu.edu/database). Colored lines = averages calculated over a moving window of 20 m to illustrate downhole trends for display purposes only. Lithologic units from Shipboard Scientific Party (2004). Vertical P-wave velocities and densities were used to calculate synthetic seismograms in Figures F9 and
F10.


![]()