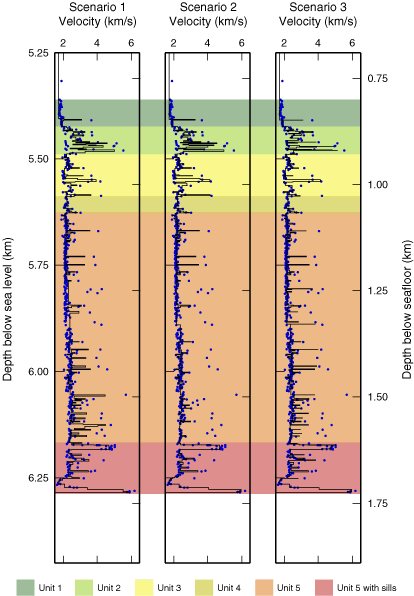
Figure F6. Velocity functions used to calculate reflection coefficient series for each of the three physical property processing scenarios described in text and illustrated in Figure
F4. Black lines = velocity functions, blue dots = laboratory measurements of vertical (z) P-wave velocities. In Scenario 1, all measured velocities from physical properties are used to pick layers and calculate reflection coefficient series. In Scenario 2, velocities >3 km/s from thin (<1 m) lithologic intervals are removed where they were measured in Unit 5 above the upper sill (1067–1612 mbsf). In Scenario 3, the thickness spanned by high-velocity laboratory measurements is modified to represent the thickness of the corresponding lithology in core descriptions.


![]()