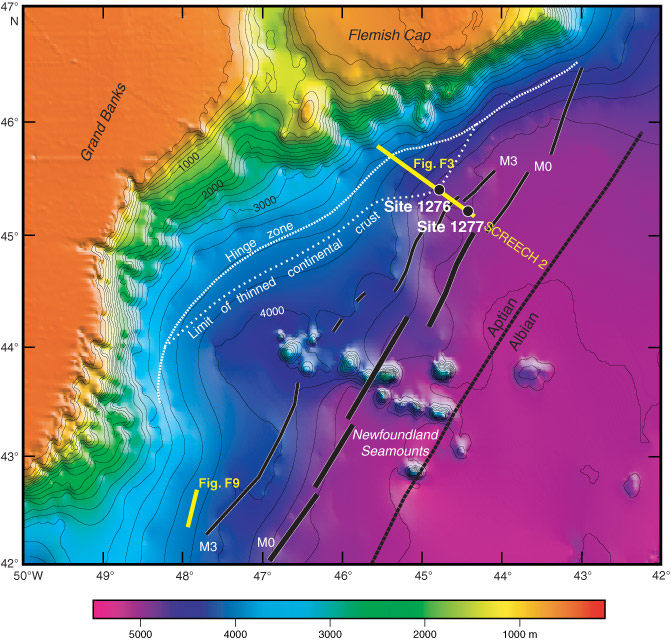
Figure F2. Bathymetry of the Newfoundland Basin, contoured at 200-m intervals, with the locations of Sites 1276 and 1277, ODP Leg 210. Magnetic anomalies M3 and M0 are shown, together with the approximate location of the Aptian/Albian boundary in crust farther seaward. The bold line at M0 shows the extent of the high-amplitude J Anomaly. Locations of seismic profiles in Figures F3 and F9 are indicated.