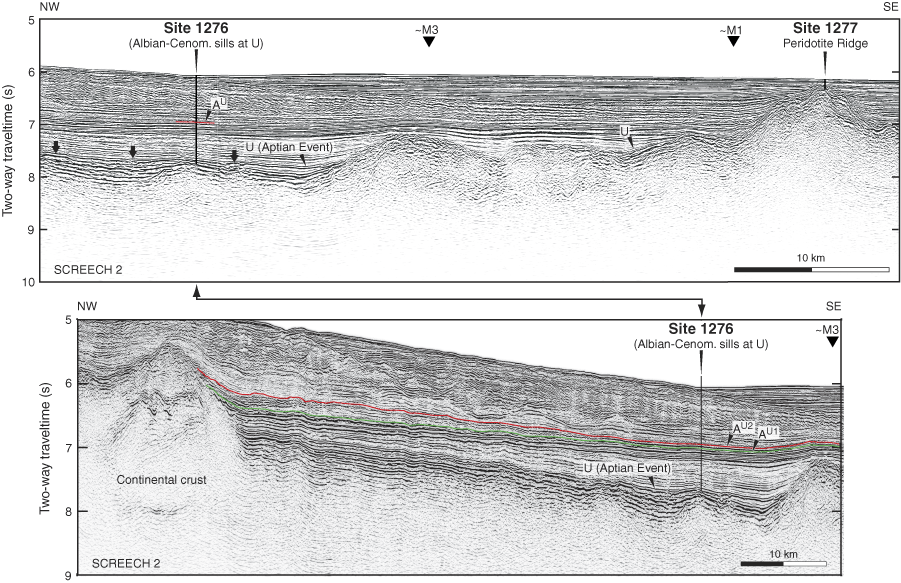
Figure F3. Parts of the SCREECH Line 2 multichannel seismic profile east (top) and west (bottom) of Site 1276. Note that the two panels are scaled differently. Locations are shown in Figure F2. Magnetic anomalies M3 and M1 are indicated. In the top panel, three arrows at left point to changes in the U reflection (= Aptian event) that suggest disruptions by igneous sills. In the lower panel, two reflections that are candidates for correlation to Horizon AU in the western North Atlantic are traced by colored lines (see text for discussion). The upper reflection is interpreted to be equivalent to Horizon AU, and it is shown as such in the top panel.


![]()